Compendia:
Automated Visual Storytelling Generation from Online Article Collection

Manusha Karunathilaka
Singapore Management University

Litian Lei
Nanyang Technological University

Yiming Gao
Nanyang Technological University

Yong Wang
Nanyang Technological University

Jiannan Li
Singapore Management University
In the digital age, readers value quantitative journalism that is clear, concise, analytical, and human-centred. To understand complex topics, they often piece together scattered facts from multiple articles. Visual storytelling can transform fragmented information into clear, engaging narratives, yet its use with unstructured online articles remains largely unexplored. To fill this gap, we present Compendia, an automated system that analyzes online articles in response to a user's query and generates a coherent data story tailored to the user's informational needs. Compendia addresses key challenges of storytelling from unstructured text through two modules covering: Online Article Retrieval, which gathers relevant articles; Data Fact Extraction, which identifies, validates, and refines quantitative facts; Fact Organization, which clusters and merges related facts into coherent thematic groups; and Visual Storytelling, which transforms the organized facts into narratives with visualizations in an interactive scrollytelling interface. We evaluated Compendia through a quantitative analysis, confirming the accuracy in fact extraction and organization, and through two user studies with 16 participants, demonstrating its usability, effectiveness, and ability to produce engaging visual stories for open-ended queries.
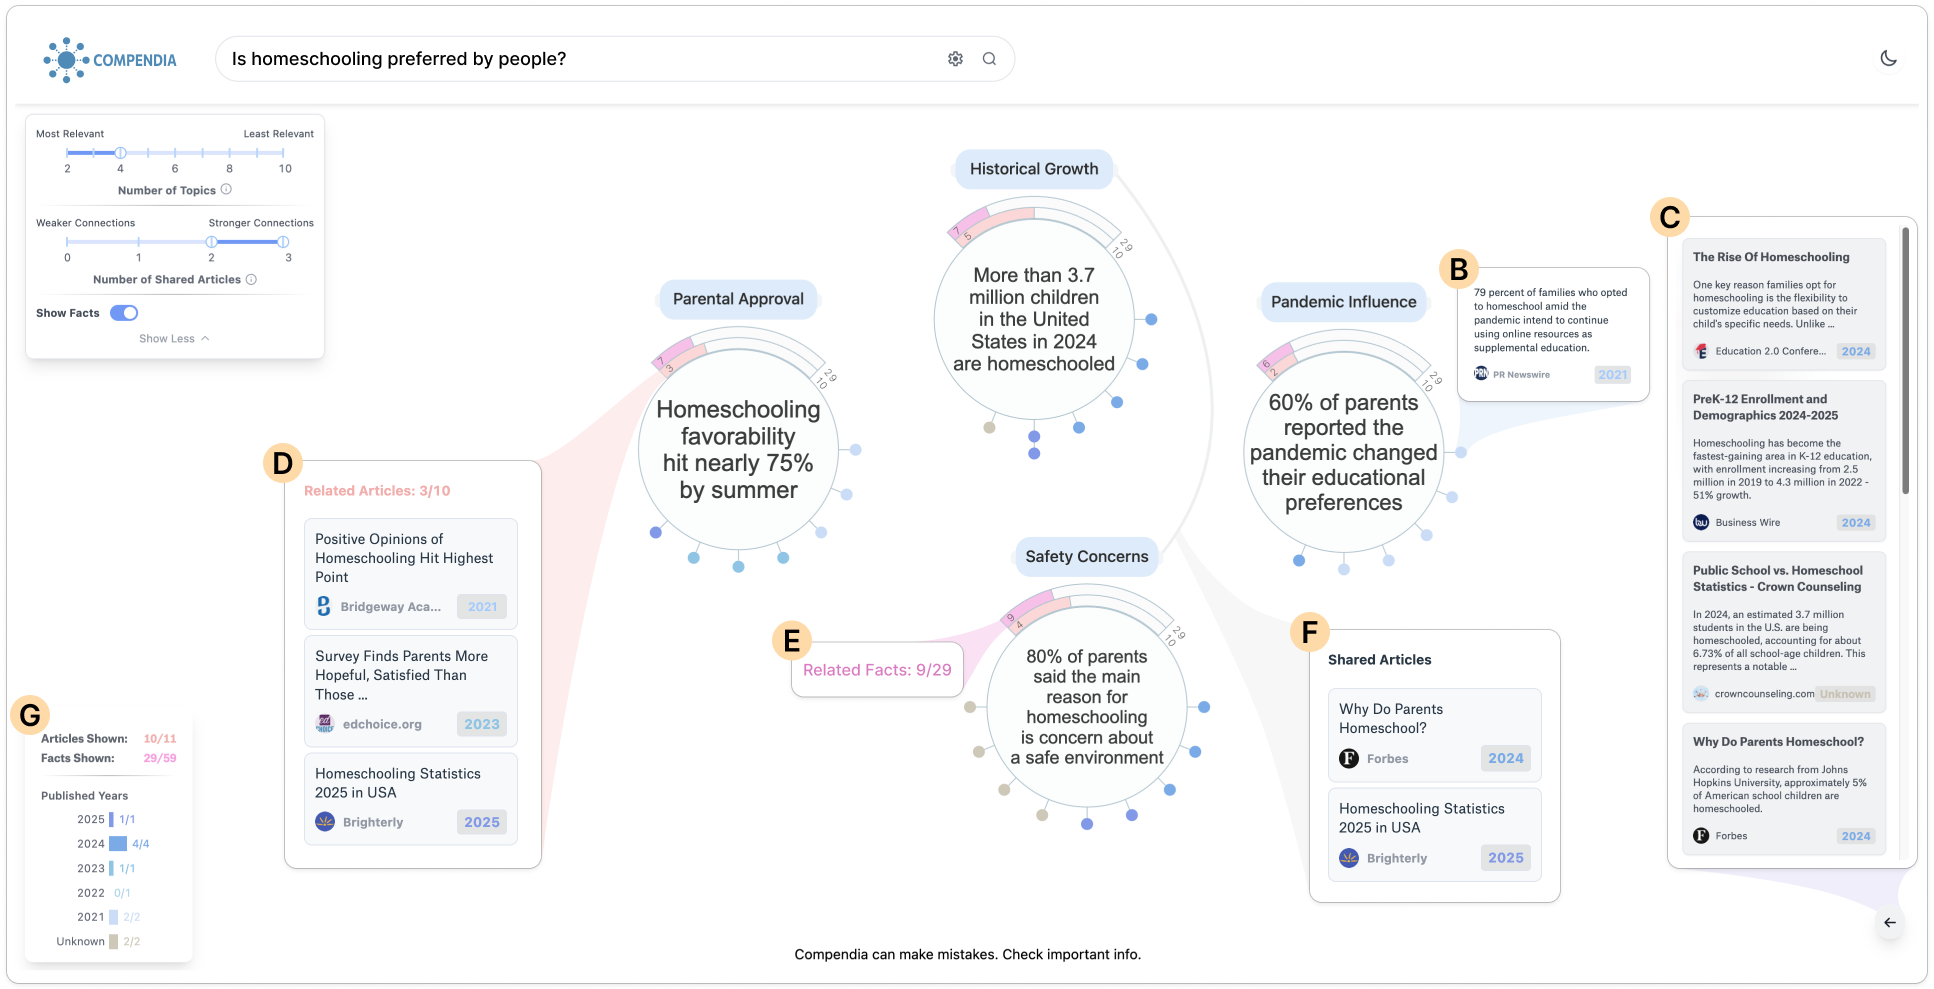
Compendia transforms the query “Is homeschooling preferred by people?” into a structured data story by extracting, clustering, and visualizing key facts using unstructured data from a collection of online articles. Thematic Overview uses Thematic Circles to visualize clustered facts across different themes. (A) Filter widget provides control over the overview, (B) Detailed fact panel provides fact content and source details, (C) Articles panel presents all retrieved articles relevant to the story, (D) Related Articles panel displays articles relevant to the topic, (E) Related facts panel provides the number of facts belonging to the topic, (F) Shared articles panel lists sources covering multiple aspects of the topic, and (G) Summary panel displays article and fact statistics.
Video Demo
Demo Examples
Explore sample data stories generated by Compendia across diverse topics.
TikTok trends
Social MediaHomeschooling trends
EducationGold prices predictions by different firms
FinanceHow was the Tesla performing in 2025
BusinessAI usage trends
TechnologyWhat are the property prices for Sydney 2025
Real EstateWhat are the market shares of global pharmaceutical companies
HealthcareStatistics of federal funds cut from different colleges and labs in US
EducationPopulation comparison: middleclass households US vs China
DemographicsExercise and heart health comparison
HealthMarriage statistics in Singapore
SocietyBYD vs Tesla car sales in recent years
AutomotiveTypical Gothic architectural style in Notre Dame de Paris
ArchitectureEricsson annual revenue 2024
BusinessSingapore population trends
DemographicsWorld population by country
DemographicsWhat is the price range of the food in Vietnam
Food & TravelThe distribution of AIDS patients in Sweden
HealthCitation
@ARTICLE{karunathilaka2026compendia,
  author={Karunathilaka, Manusha and Lei, Litian and Gao, Yiming and Wang, Yong and Li, Jiannan},
  journal={IEEE Transactions on Visualization and Computer Graphics},
  title={Compendia: Automated Visual Storytelling Generation from Online Article Collection},
  year={2026},
  volume={},
  number={},
  pages={1-15},
  keywords={Visualization;Data mining;Data visualization;Transforms;Navigation;Cognitive science;Accuracy;Usability;Search engines;Manuals;Data Storytelling;Scrollytelling;Text/Document Data},
  doi={10.1109/TVCG.2026.3663204}}